Explaining the Cohelion Data Platform
By Rick F. van der Lans • published November 23, 2020 • last updated June 20, 2024
From Master Data-Driven BI to Integrated Forecasting and Budgeting.
Get the Whitepaper
1. Introduction
Data is the lifeblood of organizations
Nowadays, no organization can function without data. Data is needed everywhere to support business and decision-making processes. Not making data available at the right time and in the right form can cripple an organization, lead to missed opportunities, result in unnecessary costs, and so on. For example, data on invoices must be stored to keep track of which customers have already paid, data on factory processes is required to determine whether they can be improved, it is needed to analyze the success if specific marketing exercises, to determine whether actual sales are in synch with sales forecasts, and to prepare regulatory reports. There are so many business processes and decision-making processes that are completely dependent on data.
The Data Warehouse environment
To support decision making, many organizations have developed data warehouse environments. Most are formed by a chain of databases, such as staging areas, data warehouses, and data marts. ETL programs are used to copy data from one database to another. With each ETL process, data is transformed for business users into more consumable data.
In a way, a data warehouse environment resembles an assembly line that converts raw data created in the source systems into consumable data for decision makers. In other words, data travels a long path from where it was created to where it is consumed.
The limitations of the Data Warehouse environment
These environments have helped many organizations well over the past 25 years. But they are not perfect. Some common drawbacks are:
- The self-made and custom-made development style of the environment leads to a slow time-to- market for reporting and analytics.
- Correction of data by business users themselves is not possible, users need to wait days or weeks for IT staff to correct the data for them.
- Forecasting and budgeting are commonly implemented as an isolated solution and not integrated with the rest of the data warehouse environment.
- Lack of descriptive metadata reduces transparency and trust in results.
- Integrating data from multiple source systems and correcting the data through master data is not supported.
The basic problem stems from the fact that most data warehouse environments are setup from an IT perspective rather than a business perspective. The focus is on making data stored in source systems available to business users, rather than on how business users prefer to work with data.
Solutions so far
The above drawbacks are known to many. Therefore, several technologies have been developed over the years to solve some of them. For example, data warehouse automation tools generate the entire data warehouse environment from models, including the ETL processes and databases. This minimizes the self-made approach, speeds up development, simplifies maintenance, and positively impacts the time-to-market. Data preparation tools use AI algorithms to determine faster how data can be transformed and integrated. Many BI tools help to create dashboards and other visual interfaces to present data in the most friendly and intuitive way. However, they do not solve all the drawbacks described.
This whitepaper
This whitepaper describes the Cohelion Data Platform. A product that is developed to solve most of the drawbacks. The following features make the product stand out:
- The Cohelion Data Platform is a master data-driven BI environment. Master data is used to integrate and improve the quality of data. The multi-domain approach for managing master data enables storage and management of any type of business object.
- The Cohelion Data Platform is an integrated product that includes data transformations, metadata, master data, a Web-based user interface for data analysis, and it supports several optional business solutions such as forecasting and budgeting, contracting, and customer profitability.
- Although the business solutions are optional, when used they are fully integrated with the data platform.
- The product covers the entire path that data travels from the source systems to the data consumers.
- The data stored in and managed by the Cohelion Data Platform is easily accessible by any third- party reporting and analysis tool that can access a SQL database server.
- The product runs on cloud platforms and is offered as a SaaS solution. Cohelion manages the product and helps to customize it to the customer’s needs.
2. Overview of the Cohelion Data Platform
The overall high-level architecture
The Cohelion Data Platform is not a data warehouse automation tool, ETL tool, BI tool, or a data preparation tool, but it does cover aspects of them all. The platform is not designed from an IT perspective, but from a business perspective. It covers essentially the entire path that data typically travels in a data warehouse environment in which it is transformed from source data to consumable data.
A high-level overview of the platform’s architecture is presented in Figure 1. Source systems are presented on the left. On the right, it shows that the data stored in the Cohelion Data Platform can be accessed by third-party business intelligence tools. In fact, data can also be extracted by third-party ETL tools to copy the data to other databases.

Figure 1 – The high-level architecture of the Cohelion Data Platform.
The four databases
Internally, the Cohelion Data Platform uses four databases to store all the data:
- Data loaded from source systems is stored in the Landing database. The platform supports features for importing data from a variety of sources, including SQL databases, flat files, and spreadsheets. Loading can be scheduled to refresh data periodically. Metadata is automatically added to indicate, for example, the source and time at which the data was loaded.
- Master data is stored in the Master database. Master data can be inserted from source systems or files or entered manually. The master data is linked to source data stored in the Landing database. The master data is used to correct and integrate data.
- The Integration database contains data after it has been integrated and corrected using the master data. In other words, the Integration database contains the data at a higher data quality level than the Landing database. The Integration database resembles a central data warehouse.
- The Data Mart contains the same data as the Integration database, except that the data structure has now been transformed into star schemas consisting of fact and dimension tables to simplify access to the data.
The solutions
The Cohelion Data Platform supports several optional business solutions such as forecasting and budgeting, contracting, and customer profitability. When used, these business solutions are fully integrated with the platform. They make full use of the platform’s components, databases, and features.
Working with data
Users of the Cohelion Data Platform can work with the data in several ways. They can use the built-in web-based UI to analyze the data and create reports and key performance indicators, they can deploy one of the optional business solutions, or they can use any third-party business intelligence tool. The whitepaper contains some screenshots created of the Web UI.
Users can correct and add data themselves. When correcting the data, the original incorrect data is kept and the correction is stored separately. The correction is used directly in the analysis of data.
Cloud platform and SaaS
The Cohelion Data Platform is available as on-premises software and on Amazon AWS and Microsoft Azure. It operates as SaaS on the two cloud platforms. In addition to offering the software, the Cohelion company also manages the software. When problems occur, they fix them. The product can be customized to fit specific needs of customers.
3. Loading data into the Landing database
This chapter describes loading data from source systems into the Landing database.The structure of the Landing database
Data extracted from source systems is stored unaltered in the Landing database. The source for loading data can be almost any kind of system, including transactional systems, data warehouses, or files. Different techniques are supported to load that data from the sources. The Landing database can be compared to concepts such as the operational data store and the persistent staging area.
The structures of the tables in this database resemble the structures of the tables in the source systems. For example, if a source system contains an order heading and an order line table, the Landing database will also contain both tables. No integration takes place in the Landing database; see Figure 2. In other words, the product applies data herding during this loading process. This means that data from multiple sources is brought together and stored in one environment without changing the source data. It is like herding cattle and guiding them all together from several pens to one pen.

Figure 2 – Data from source systems is brought together in the Landing database.
Metadata
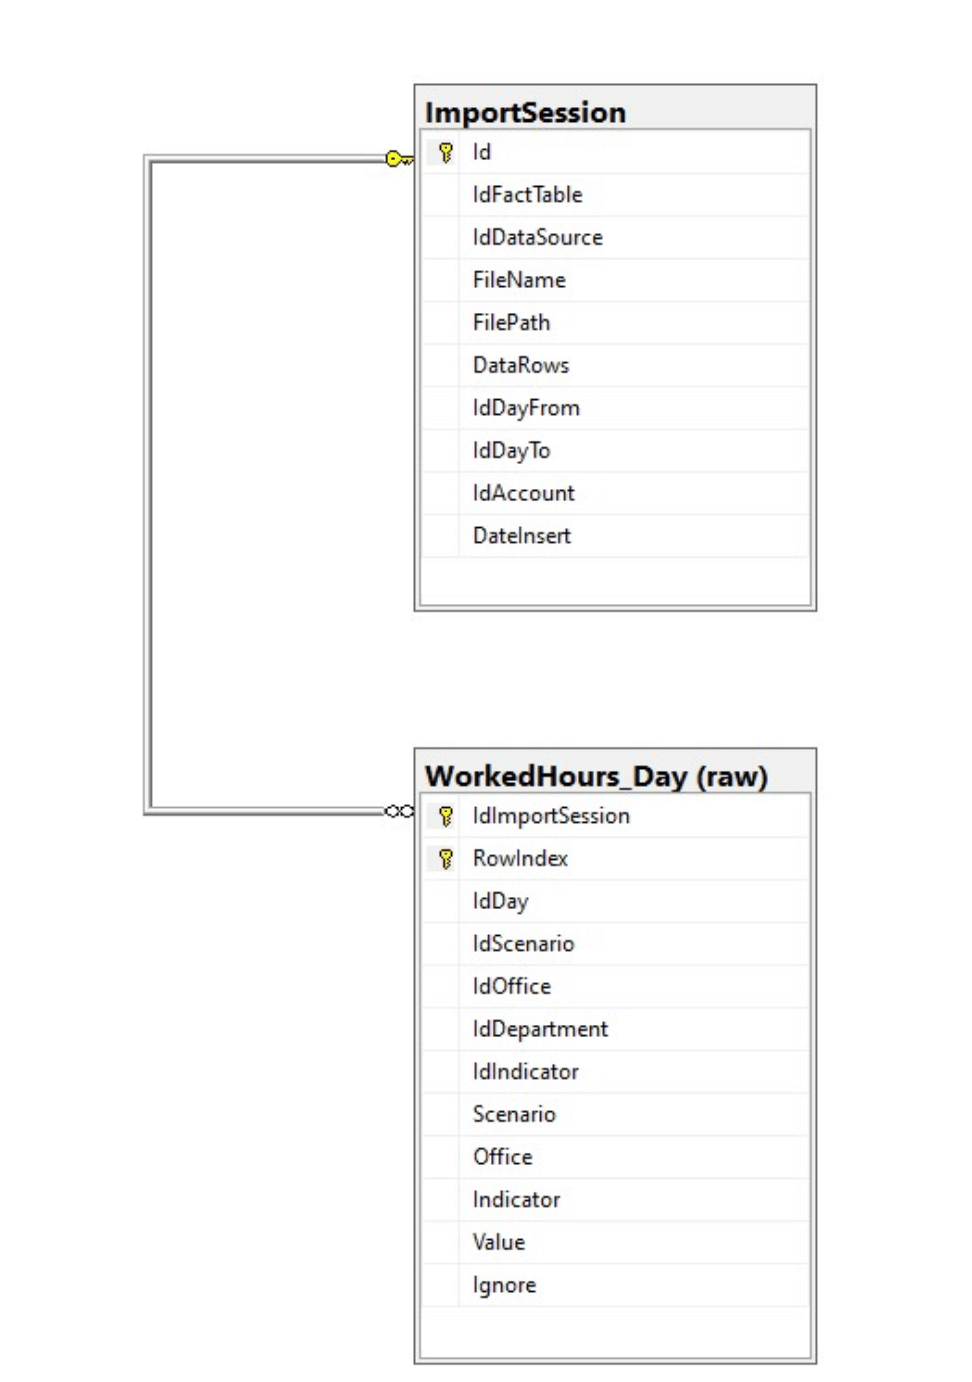
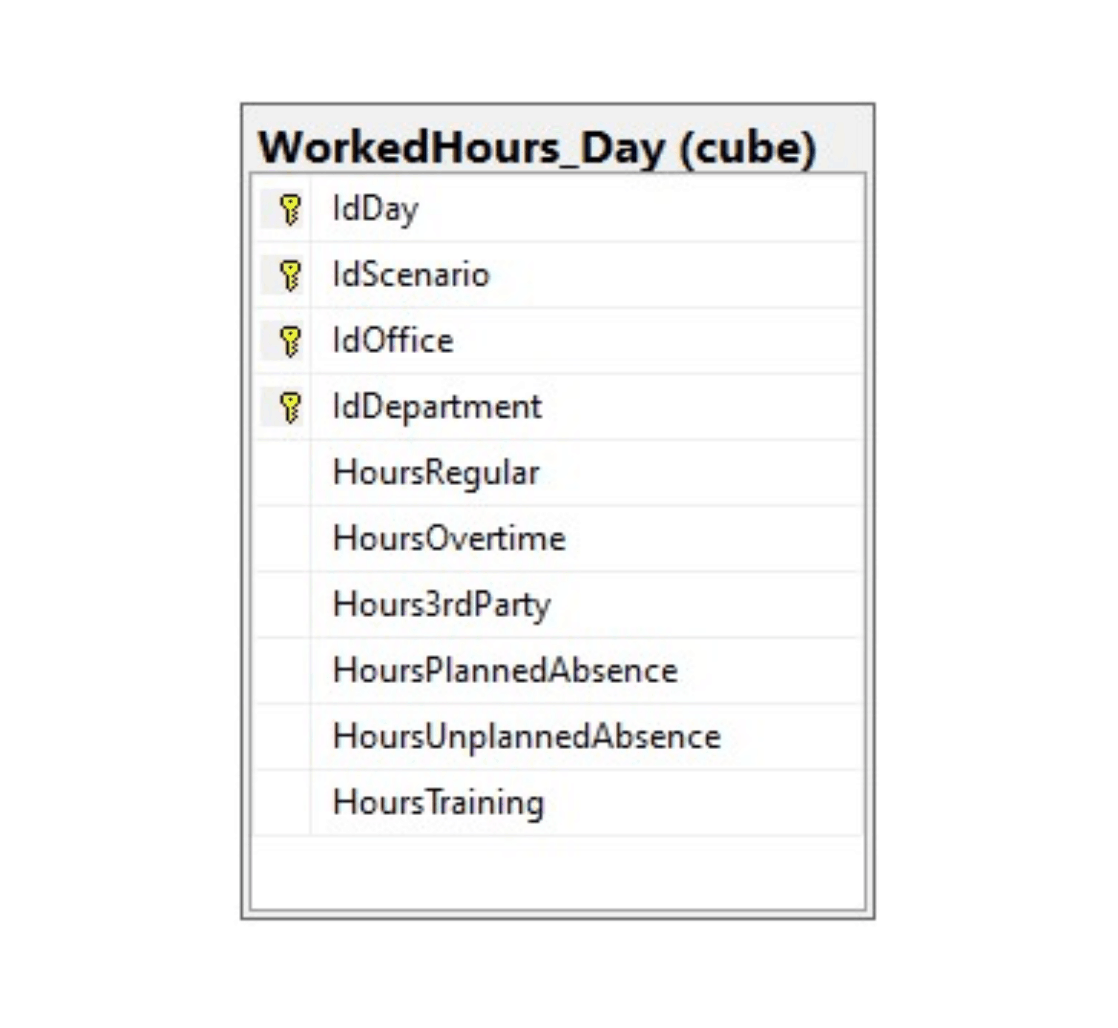
The Cohelion Data Platform adds some extra columns to each table that are reserved for storing metadata. For example, Figure 3 shows the structure of a table in the Landing database called WorkedHours_Day. It contains several values for a specific combination of day, scenario, office, department, and indicator. The metadata is stored in a separate table called ImportSession, which includes the name of the source system and table, the number of rows inserted, and the date and time the data was loaded.
If the structure of the source data is not ‘flat’, for example, it is made up of hierarchies, vectors, or dynamic constructs, the data is flattened into a relational data structure before it is loaded in the Landing database.
Figure 3 – An example of the data structure of a table in the Landing database.
Refreshing data in the Landing database
Loading processes are scheduled in a similar way as with ETL tools. A loading schedule is maintained that indicates when the data of which source system is loaded and refreshed; see Figure 4.
The platform usually operates with a heartbeat of 10 minutes. Every 10 minutes it checks the loading schedule to determine if a loading process needs to be executed. If it is time to start one, but the data is not available, the system checks 10 minutes later and repeats this process.

Figure 4 – Overview of all the scheduled loading processes.
Keeping track of history
The history of data is automatically kept. When data is loaded, the platform checks whether the source data has changed. When a new version of the data is stored in the Landing database, the old version is also kept. When data is deleted in a source system, the data in the Landing database is noted as deleted.
Incorrect data
Data loaded from source systems may contain incorrect and missing data. The Cohelion Data Platform uses master data to correct this and to fill in the missing data. How this process works is described in Chapter 6 and master data is described in the next chapter.
The Landing database versus Data Lakes
Typically, data lakes are developed to support data scientists and other investigative analysts. Such users prefer original, unchanged data, because processed data can affect the models they develop. Therefore, data lakes also contain unchanged data. Often, a data lake is a data store in which data from several source systems is herded together.
Since the Landing database contains the original, unchanged data and because it is accessible by business users, it can be used as a data lake. For example, data scientists can access the Landing database when they need access to the unprocessed raw data. The advantage is that they also have access to all the descriptive metadata. They do not need to waste time on discovering what all the data elements mean.
Conclusion, the Landing database can be used in a similar way as a data lake. However, some differences exist. First, when source data does not have a flat structure, it will not be flattened when loaded into a data lake. Second, not all data lakes use SQL technology to store data, which means they may support other APIs and languages for data access.
4. Loading and managing Master Data
Integrated Master Data Management
The strength and uniqueness of the Cohelion Data Platform comes from its integrated support for master data. Master data is stored in the Master database. In addition to the master data itself, it stores how the master data is linked to the source data. In many master data management systems, master data is stored in a separate system. In Cohelion Data Platform it is fully integrated with the rest of the system.
Master data can be entered in different ways; see Figure 5. Data can be entered manually, loaded from source systems and files, such as spreadsheets. For example, when a specific source system contains a table holding all the product group codes and the quality of that data is considered high, it can be imported as master data. Once the master data has been loaded, it can be changed, managed, documented, and extended as required.

Figure 5 – Different ways to enter master data.
Linking Master Data to source data
Data from a source system may be incorrect or missing. Users can indicate in the Master database what the correct data or the missing data should be by linking it to the correct master data. For example, if the customer name in a sales transaction record is incorrect, the record is linked to the correct customer name stored in the Master database. Or, if the customer name in a sales transaction record is completely missing, it can be linked to the appropriate one in the Master database.
Creating links between source and master data is easy. First, a column in the Landing database is linked to a master data column. The system then checks whether all the source values have a corresponding master data value. An example of the result of such a comparison is presented in Figure 6. The right side of the screenshot shows the customers imported from a source system and loaded into the Landing database and the left side shows the customers as defined in the Master database.
When needed, incorrect and missing source values can be linked to the correct master data values. If a source value is incorrect, it can be linked to the correct one, and this source systems contains a new correct value, it can be added to the master data.
Note that the data in the Landing database remains unchanged. Only the links between the source and master data are stored in the Master database.
Different source systems may use different classification codes to indicate the same item. For example, in a multi-national company, different applications often use different names or codes to identify the same customer. This complicates the data integration process. Figure 6 shows that the DCS Flight application uses 2-letter codes for customers, while the company standard Master database uses 3- letter codes. This problem is solved by linking these different items to the corresponding master data items. In other words, a specific master data value can be linked to many different values in different source columns.
Note that several source items can be mapped to one master item. In the example above, the customers CV-CargoLux and CVT-CargoLux Trucking are both linked to CLX-CargoLux Airlines in the Master database, and vice versa, CES-China Eastern Airlines, CKK-China Cargo and CSN-China Southern Airlines in the Master database are all linked to MU-China Airlines in the Landing database.

Figure 6 – An example of linking source data to master data.
A connection can be created by dragging and dropping an item. Figure 6 shows how A5-Air France HOP is mapped to AFR-Air France.
Hierarchical levels can also be introduced. This is used, for example, to indicate that specific product groups belong to product classes, or that stores are grouped in countries, and countries in regions. Figure 7 shows an example where customers can belong to companies, parent companies, and sectors. These hierarchical structures are used by the Cohelion Data Platform to aggregate data when it is loaded into the Data mart.

Figure 7 – An example of a hierachical structure of master data.
5. Integrating data in the Integration database
Integrating data
Once the source data has been loaded into the Landing database, it can be copied to the Integration database. As indicated in Chapter 3, data in the Landing database has not yet been integrated and may still contain incorrect and missing data. Integration and the data correction take place during the loading of data into the Integration database. The linked information stored in the Master database plays a crucial role in this; see Figure 8.

Figure 8 – The Integration database contains data from the Landing database and is linked to master data from the Master data database during the loading process.
For example, when a specific record is missing a value and this value is linked to a master data value, the master data value is used when loading the Integration database. The same applies to incorrect values that are linked to correct master data values. The latter are used in the Integration database. It is as if the master data value replaces the incorrect value. A similar process takes place during integration. If two tables contain customer data and both are linked to the same master data, the master data is used to store the integrated customer data. This also applies when two tables contain completely different product category codes. The data is nevertheless correctly integrated using the master data links.
Data structure of fact tables
The structures of the tables in the Integration database are all very similar. One record is stored for each attribute value. In other words, if a Time&Attendance application supplies the employee’s worked hours to the Landing database, each record can contain data for Worked Hours, Holiday hours, and Sick leave. A separate record is kept for each in the Integration database. Key values keep them linked together.
Besides the user data, the Integration database contains metadata. Examples of metadata are the source, whether the data is confirmed, and whether it is updated by which business user. Figure 9 shows an example of a table in the Integration database called WorkedHours_Day. It stores the data from the table shown in Figure 3 with a similar name. The Value column contains the actual values.
Figure 9 – The structures of all the Integration database tables are similar; a separate record is stored for each value.
The main advantage of this approach is that when a new column is added to a table in the source system, the structure of the Integration database table does not need to be changed. Storing an extra record in the table is sufficient.
Loading the Integration database
The processes to copy and update the Integration database must be scheduled. The process resembles an Extract-Load-Transform (ELT) processes. The data is first extracted from the Landing database, then transformed, integrated, and loaded into the Integration database.
To copy data from the Landing database to the Integration database, the Cohelion Data Platform uses the query execution power of the underlying SQL database server. SQL statements are created to query the data from the Landing database, link it to the master data, and insert the result into the Integration database. Therefore, the speed of the database server determines the speed of this process.
6. Correcting data
Incorrect data
Data from source systems is not always correct. For example, a large order may have been cancelled just before a quarterly board meeting. It will take a week for the cancellation to be correctly entered into the Sales system and then propagated to the data warehouse.
The traditional approach for correcting data
When business users discover incorrect data in traditional data warehouse environments, they commonly initiate a procedure that begins with notifying the owner of the data. The owner is responsible for changing the data in the source system. The next time the data warehouse is refreshed, the new data is loaded, and the incorrect value is corrected.
In many organizations, the time that elapses between the user’s call and when the user can use the corrected data in reports and dashboards can be long, sometimes even weeks. The corrected data must first be processed by the existing data factory. Meanwhile, business users cannot analyze the data or create summary reports. Often, they choose to copy the reported data, including the incorrect data, to a spreadsheet, correct it there, and then develop their reports with another tool.
This approach is far from ideal. Because the next time a report needs to be developed, the business users need to correct the data again. From an auditing and governance perspective, this entire process is undocumented and ungovernable.
The Cohelion approach for correcting data
In the Cohelion Data Platform, business users can change incorrect data themselves, so that the corrections immediately appear in all the reports. Additionally, the corrections and original values are still available to users. When they hover over certain values, they see how the value is calculated. Figure 10 shows an example where a correct value of sales income is known to be 185,254. This value is entered as the calculated total provided by SAP and Salesforce.com. The correction value of 20,248 is saved by the platform as a Manual counter booking.

Figure 10 – Users can see how values are built up.
The Cohelion Data Platform stores the corrections in the Integration database, along with metadata, such as the date of the corrections and the user. In other words, this audit trail keeps track of incorrect and corrected values.
Note that the source systems still contain the incorrect data. Thus, a procedure is required that warns owners that data in the source systems needs to be corrected.
Adding data
Besides correcting data, users can also add data to the Integration database. Several reasons exist why users may want to add data:
- A specific form of reporting requires data not available in any source system.
- Data is needed from a source system from which data cannot be automatically extracted.
- Data should have been loaded from a source system, but was not loaded or could not be loaded.
As with corrections, the Cohelion Data Platform keeps track of the fact that this data was added by the users.
7. Copying data to the Data mart
The Data mart
The Integration database contains corrected versions of all the data in a highly structured way. Unfortunately, for users analyzing the data the table structures are somewhat difficult to access and the queries on them are not very fast. Therefore, data is copied to the fourth database, the Data mart, in which the data has an easy-to-query data structure.
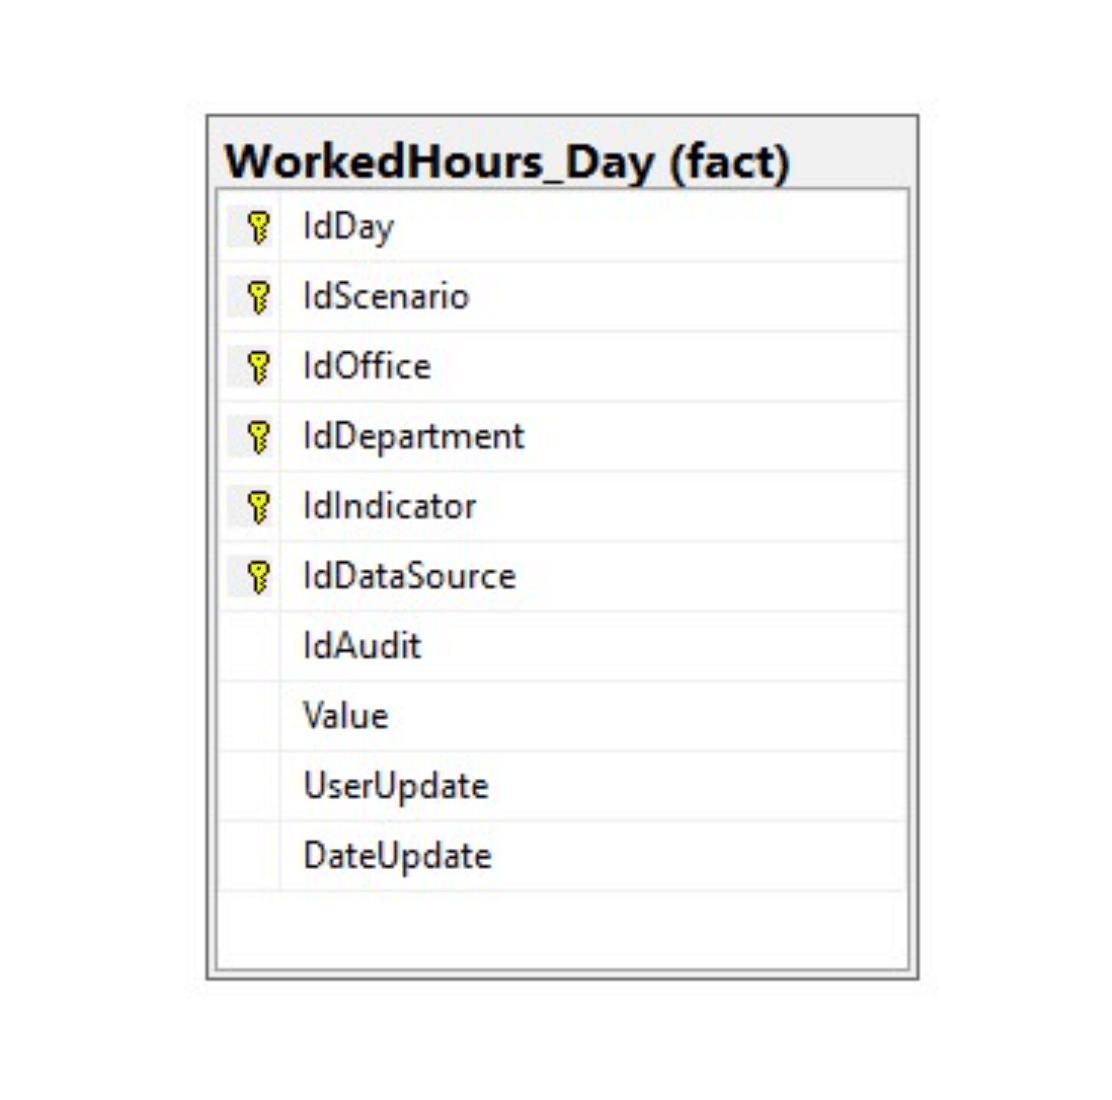
In the Data mart, data can be organized as traditional star schemas. Data is stored in fact and dimension tables. Here, values are not stored in separate records, but together in one record. Figure 11 shows as an example the structure of a fact table called WorkedHours_Day
In addition to the advantage of making this structure easier to access, most SQL database servers support query optimization techniques to efficiently execute queries on star schema patterns.
Figure 11 – The data in the Data mart is organized as star schemas consisting of fact and dimension tables.
Views on the Data mart
Views are defined on the physical tables in the Data mart. These views are used to restrict data access for specific users. For example, if sales people are only allowed to see sales transactions from the region they are responsible for, they only see the data they are allowed to see when they access the views. Or, if users are only allowed to see aggregated sales data, the views will only show that and prevent access to the detailed data. Views are grouped in schemas. User(group)s can be assigned to schemas. Access restrictions can be granted to all views defined in a schema.
Open access to the Data mart
The Data mart is used by several Cohelion solutions and modules for reporting. The structure of the tables also makes it suitable for access by third-party BI tools. Most BI tools know how to access and query such data structures easily and efficiently.
Loading the Data mart
The processes to update the Data mart are scheduled. Data is extracted from the Integration database, transformed into fact and dimension tables, and loaded into the Data mart. The Cohelion Data Platform creates SQL statements to query the Integration database tables, transform the data, and insert the result in the Data mart.
8. Analyzing data
As indicated in Chapter 2, besides the options offered by the Cohelion Data Platform to analyze data, any third-party BI tool can work with its data. The star schema structures make it easy for most of these tools to work with the data. The forecasting and budgeting data is also available. Data can be extracted from the Integration database or Data mart with a straightforward 1:1 ETL process.
Data scientists generally prefer to use unprocessed, source data when developing descriptive and prescriptive models. Instead of accessing the sources themselves, they can also access the Landing database to get to the uncorrected source data. Or, if desired, they can access the Integration database in which the data has been standardized using master data.
9. Documenting data with Metadata
Supplying Metadata
Data without metadata is useless. Displaying a data value with the simple heading price is not sufficient. Users may have tons of questions. Is this price excluding or including tax? Is it the default price or the discounted price? Where does the data come from, did it come from one of the internal source systems or an external source? How old is that data? Has it been corrected by users? Did all the processes that load data required to produce a specific data value run successfully?
The Cohelion Data Platform can provide metadata to business users. This allows descriptive and other types of metadata to be entered and managed; see Figure 12 for an example of metadata about offices. As indicated in Chapter 3, the Cohelion Data Platform keeps track of the source of all loaded data and is available to users.

Figure 12 – Defining metadata on data elements and KPI’s.
Zero mouse-clicks-away Metadata
For business users, access to most metadata is less than one mouse-click away. By hovering over data values, the platform automatically shows the metadata, including the definition, what the source of the data is, and also, if relevant, whether that data has been corrected and by whom; see Figure 13.

Figure 13 – Metadata is automatically shown by hovering over data values.
10. A transparent loading process
Loading process available to business users
In many traditional data warehouse environments, business users cannot access information related to the loading processes, because scheduling and loading are not handled by the tools they have access to. Therefore, they cannot see when data was loaded or whether a scheduled loading process actually took place and successfully completed or crashed. This is unfortunate, because this type of information can be useful to business users.
For example, in a retail company, sales data from all stores is uploaded to the central data warehouse and processed every night. Every morning, users can study the sales data of the previous day. But what if the sales data of one store failed to load successfully due to some technical glitch? When users are not aware of this, they may make a decision based on incomplete sales data.
Loading process is transparent
If allowed, business users of the Cohelion Data Platform can see the scheduled loading processes and also whether loading processes completed successfully or not; see Figure 14. They can see whether data from specific sources was loaded, how long it took, how many rows were processed, and also if loading processes resulted in errors and warnings.
Users can use this information to determine whether all the data necessary for their reports has actually been loaded successfully. This insight into the loading processes makes loading data a much more transparent process for the users (instead of a black box) and increases trust in the data they see.
A reload of data can also be requested by business users. This may be necessary if source data is accidentally mapped to the wrong master data. After reloading, the correct mapping can be applied.

Figure 14 – Overview of the status of loading processes.
11. Working with business solutions
The Cohelion Data Platform supports several optional business solutions for e.g. forecasting and budgeting, contracting, and customer profitability. To show how such a solution is integrated with the platform, the Forecasting solution is described as an example. The other business solutions are implemented in a similar way.
Forecasting
Forecasting is the art and science of predicting future events. Organizations want to compare what has happened within the business with what was expected to happen. By comparing actual data with forecasted data, they can see whether everything is going according to plan and monitor the resources that have already been spent. This enables business users to verify whether, for example, sales data or the number of new patients are still in line with the forecast. These comparisons allow them to manage business processes. Users need to be able to change those forecasts on the spot. Forecasting data can be financial or numerical, and indicate the expected number of products to be sold or the expected spill levels in a factory.
Forecasting in traditional Data Warehouse environments
In most data warehouse environments users cannot enter forecasting and budgeting data. In these environments data ‘flows’ from the sources to the data consumers and not ‘backwards’. Users typically solve this by running the forecasting outside of the data warehouse environment. The real data presented by the data warehouse is usually copied from the report and pasted into a spreadsheet where they extend it with forecasting data. They use Excel to compare the two types of data. This is a very time-consuming and error-prone approach. Rather than using Excel, some use a stand-alone forecasting tool, but this also involves copying data from the data warehouse environment to the forecasting tool. This can lead to inconsistent data across reports and dashboards.
Forecasting in Cohelion
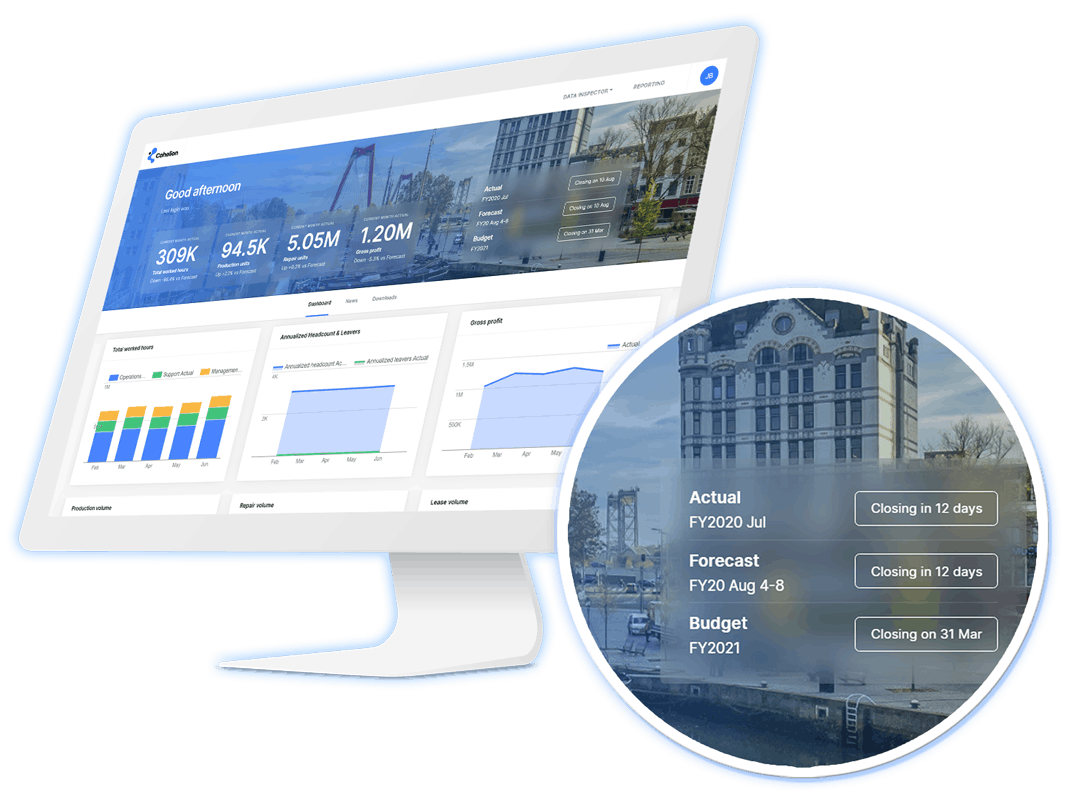
The Cohelion Data Platform stores the forecasting data in the Integration database. It can be entered through a loading process and manually in a similar way as source data. Additionally, it can use machine learning algorithms to predict or estimate the forecasts. For example, sales forecasts can be predicted based on historic sales data, and flight schedules can be predicted based on previous schedules. These predicted forecasts can be changed manually. Forecasting data can be compared with the real data; see Figure 15 as an example.

Figure 15 – Comparing forecasting data with actual data.
Changing the forecasts
New insights can lead to forecast changes. Therefore, besides studying whether forecasts are met, users can time travel to study whether forecasts have improved over time. They can go back in time to see how good forecasts were at different times. Suppose that one million copies of a specific product are forecasted to be sold at the beginning of the year, after one or two months the organization may want to change that number as it becomes clearer what the true total sales figure will be. In fact, it is quite common for organizations to define new forecasts at the end of every month. The Cohelion Data Platform keeps track of all the forecast versions. So, users can compare the real data with each individual forecast to see how good each forecast was. It may be that the first prediction was far off, but after 3 months it became quite accurate.
Approving forecasts
Approving Forecasts – New forecasts are not automatically active. They must be approved. The Cohelion Data Platform supports a process cycle to approve forecasts; see Figure 16.

Figure 16 – The process cycle to approve forecasts.
Budgeting
Forecasting data is typically captured on a monthly basis and includes the forecast through the end of the current fiscal year. A budget is usually entered as a plan for the following year. Like forecasts, budgets can be defined on any indicator (not just financial). Several budget-rounds can be made in a year, each with a strict approval workflow. The budgeted data remains available throughout the system to compare actual with forecasting data.
12. Use cases of the Cohelion Data Platform
The Cohelion Data Platform supports a wide range of use cases. This chapter describes some popular ones.Integrating Data Warehouses
Some companies have multiple data warehouse environments. This may have been caused by mergers with or acquisition of other companies, or merely be a result of their decentralized character of the company. If multiple data warehouses exist, the platform can be used to integrate data from all of them and present an integrated view of the data to the organization. The Cohelion Data Platform treats these data warehouse environments as source systems. When inconsistencies exist in the data warehouses with regards to definitions, codings, values, or languages, the master data can link data together to present a consistent and an integrated view of all the data.
Migrating ackaged applications
Sometimes organizations need to migrate to another packaged application, for example, they have to replace their financial package or human resource system with another one. In most cases, these new packaged applications store data differently, use different concept definition, and use different sets of concepts. This can lead to inconsistencies in reporting over time. The Cohelion Data Platform can be used to present a consistent state of the data over time when, for example, a company migrates its financial data to another product. Users can be shielded from this migration. While IT works on the migration, the platform continues to deliver consistent data.
Upgrading packaged applications
When a packaged application is upgraded to a new version, some reporting results may be different due to changed definitions. Also, the structure of how data is stored may have been changed to accommodate new features within the application. This can also lead to inconsistent reporting over time. The Cohelion Data Platform allows users to be shielded from this upgrade. Results can stay in line with older results.
Forecasting and budgeting
An obvious use case of the Cohelion Data Platform is forecasting and budgeting. Most BI tools and data warehouse environments do not support forecasting and budgeting features. That kind of functionality must be developed by organizations themselves or dedicated tools for forecasting and budgeting must be deployed. These features are built into the platform and supported by the heart of the system. The forecasting and budgeting solution, although an optional module, is fully integrated with the Cohelion Data Platform.
Traditional business intelligence
Due to its master data-driven approach for integrating and correcting data, it can be used to improve the data processed by BI tools such as Microsoft Power BI, Qlik Sense, and Tableau.
Data Warehouse environment
The Cohelion Data Platform can also act as a data warehouse environment. Especially organizations that do not yet have a data warehouse can develop one quickly. Rather than having to select a set of products and spend time integrating them, the Cohelion Data Platform supports almost all of the required features. Especially the support for cloud platforms and SaaS makes it an easy implementation process.
13. Closing remarks
The Cohelion Data Platform is different from many other products deployed in business intelligence and data warehouse environments. In a nutshell, these are its strengths:
- The product covers most of the functionality required to develop and operate a data warehouse environment.
- It enables a master data-driven approach to BI; everything revolves around master data, including integrating and correcting data.
- It supports built-in features for forecasting and budgeting, including support for forecasting approval cycles, machine learning algorithms to predict forecasts, and time travel when comparing actual and forecasted data.
- Users can correct data themselves allowing them to look at reports that show the corrected values.
- It is an open solution; customers can decide how they want to use the product and which modules they need. They can use third-party BI tools, such as Power BI, QlikView, and Tableau, to query and analyze the data.
- Zero mouse-click-away metadata access to improve transparency.
About the author
Rick van der Lans is a highly-respected independent analyst, consultant, author, and internationally acclaimed lecturer specializing in data architecture, data warehousing, business intelligence, big data, database technology, and data virtualization. He works for R20/Consultancy (www.r20.nl), which he founded in 1987. In 2018, he was selected the sixth most influential BI analyst worldwide by onalytica.com.
He has presented countless seminars, webinars, and keynotes at industry-leading conferences. For many years, he has served as the chairman of the annual European Enterprise Data and Business Intelligence Conference in London and the annual Data Warehousing and Business Intelligence Summit.
Rick helps clients worldwide to design their data warehouse, big data, and business intelligence architectures and solutions and assists them with selecting the right products. He has been influential in introducing the new logical data warehouse architecture worldwide which helps organizations to develop more agile business intelligence systems. He introduced the business intelligence architecture called the Data Delivery Platform in 2009 in a number of articles all published at B-eye-Network.com.
He is the author of several books on computing, including his new Data Virtualization: Selected Writings and Data Virtualization for Business Intelligence Systems. Some of these books are available in different languages. Books such as the popular Introduction to SQL is available in English, Dutch, Italian, Chinese, and German and is sold worldwide. Over the years, he has authored hundreds of articles and blogs for newspapers and websites and has authored many educational and popular white papers for a long list of vendors. He was the author of the first available book on SQL, entitled Introduction to SQL, which has been translated into several languages with more than 100,000 copies sold.
For more information please visit www.r20.nl, or send an email to rick@r20.nl. You can also get in touch with him via LinkedIn and Twitter.
Ambassador of Axians Business Analytics Laren: Thisconsultancy company specializes in business intelligence, data management, big data, data warehousing, data virtualization, and analytics. In this part- time role, Rick works closely together with the consultants in many projects. Their joint experiences and insights are shared in seminars, webinars, blogs, and whitepapers.
About Cohelion
Cohelion is a one-stop-shop for fast growing organizations that have data integration challenges. With a unique service-oriented approach the company takes the burden of data-integration away from their customers, who in return get a user-friendly data platform with sophisticated data-quality controls and build in business solutions like Forecasting and Budgeting, Contracting and SLA management, and Customer profitability. Check out the case studies and request a demo.
See how it really works!
Schedule a demo with one of our experts to learn how the Cohelion Data Platform gets more out of your data.